
An SEO keyword ranking report is far more than just a list of where your website shows up for a few search terms. Think of it as your strategic blueprint, a map that reveals exactly how your site is performing in search over time. It's the key to making data-driven decisions instead of just guessing what to do next with your content.
What Your SEO Keyword Ranking Report Truly Reveals
Viewing a keyword report as just a list of rankings is like looking at your car's speedometer but ignoring the fuel gauge and engine temperature. Sure, you know how fast you're going, but you're missing the crucial context that tells you about your engine's health and how much further you can go.
A proper report is a dynamic diagnostic tool. It tells a story about your content, your audience, and your place in the market.
It’s what helps you answer the questions that really matter to the business:
Are our content marketing efforts actually paying off?
Which topics are truly resonating with our ideal customers?
Where are our competitors beating us, and why?
Are we showing up for people at every stage of their buying journey?
A simple, static list of keywords just can't do that. Why? Because the search engine results pages (SERPs) are no longer a simple collection of ten blue links. They're a rich, interactive mix of features designed to answer questions right there on the page.
A well-crafted SEO keyword ranking report is your guide to navigating this complex environment. It translates raw data into a clear narrative, showing you where you are, where you've been, and where you need to go to capture more organic traffic.
Beyond the Blue Links
The SERP has changed dramatically, and the data proves it. A recent analysis found that an incredible 97% of searches now include SERP features like featured snippets, "People Also Ask" boxes, and AI-generated overviews.
This directly impacts how users interact with search results. The rise of AI Overviews, for example, has shaken up click-through rates (CTR), which is exactly why tracking your rank alone is no longer enough. Even with all these changes, the number one organic result still pulls in a huge average CTR of 39.8%, proving that securing those top spots is as valuable as ever. You can dig deeper into how SERP features affect organic performance if you want to understand the nuts and bolts.
Essential Metrics for Your Ranking Report
To get a full picture, your report needs to track a core set of metrics. Each one tells a different part of your performance story.
Metric | What It Measures | Why It's Important |
|---|---|---|
Keyword Rank | Your website's organic position for a specific keyword. | The foundational metric. Higher ranks generally mean more visibility. |
Search Volume | The average number of times a keyword is searched per month. | Indicates the potential traffic you can get from a keyword. |
Impressions | How many times your URL appeared in search results for a query. | Measures your overall visibility, even if users don't click. |
Click-Through Rate (CTR) | The percentage of impressions that result in a click. | Shows how compelling your title tag and meta description are. |
Traffic | The number of organic visitors from a specific keyword. | The ultimate measure of whether your ranking is driving real users. |
SERP Features | Whether you own features like snippets, PAA, or image packs. | Highlights opportunities to dominate the SERP beyond the blue links. |
This combination of data points gives you a holistic view, moving you from simply "tracking ranks" to strategically managing your organic presence.
Pinpointing Growth Opportunities
Ultimately, an effective SEO keyword ranking report shows you the path forward. It helps you find your "striking distance" keywords—those terms sitting on the second page that just need a little optimization to pop onto page one.
It also acts as an early warning system for content decay, flagging high-performing articles that are starting to lose ground and need a refresh. This proactive approach turns your SEO from a reactive guessing game into a repeatable, strategic process for sustainable growth.
How To Gather Your Core Ranking Data
An SEO keyword ranking report only shines when your data does too. It’s not enough to grab a list of terms—you need to collect meaningful metrics from trusted sources. At the top of that list is Google Search Console (GSC).
GSC is Google’s free tool that reveals exactly how your site appears in search. You get impressions, clicks, click-through rate (CTR), and average position straight from the source. This raw, unfiltered data forms the backbone of any thorough SEO report.
Starting With Google Search Console
Begin by opening the ‘Performance’ section inside your GSC property. From here, you can:
Apply a date range filter.
Drill down into specific pages.
Compare desktop vs. mobile traffic.
Once you see the query table, export it into a spreadsheet. This list will cover every keyword your site showed up for—high-volume head terms and niche phrases alike.
Pro Tip: Don’t stick to the default export. Use filters to split brand queries from non-brand ones, or focus on a single URL. That way, your insights become more precise and actionable.
Enriching Your Data With Third-Party Tools
GSC gives you the facts. Third-party tools like Semrush or Ahrefs explain the context. They help answer the “why” behind your raw numbers.
By blending GSC’s keyword list with external data, you can add:
Monthly Search Volume: Gauges potential traffic to prioritize terms.
Keyword Difficulty (KD): Estimates how tough it is to rank.
SERP Features: Flags snippets, “People Also Ask” boxes, video packs, and more.
Imagine you rank #8 for a high-impression keyword but see a low CTR. A tool might reveal a dominant video carousel on that SERP. That clue suggests producing video content could lift your clicks. This approach is particularly valuable when doing in-depth long-tail keyword research. These tools surface those hidden gems with strong intent and less competition.
When you merge the performance data from Google Search Console with insights from other platforms, you end up with a powerful, holistic dataset. Suddenly, a simple keyword list transforms into a strategic blueprint—one that drives real decisions in your SEO report.
Building a Report That Tells a Story
Okay, you've pulled your keyword data from Google Search Console and your other tools. Now what? A raw data dump is just noise. The real magic happens when you organize that data into a report that tells a clear, compelling story about your SEO performance.
The goal here is simple: build something a client or stakeholder can grasp in 30 seconds. They need to see the wins, the losses, and the opportunities without needing a dissertation. Let's walk through how to set this up in a basic spreadsheet tool like Google Sheets. We're going to turn scattered metrics into a coherent narrative.
This whole process is about transforming raw inputs into a single source of truth for your keyword strategy.
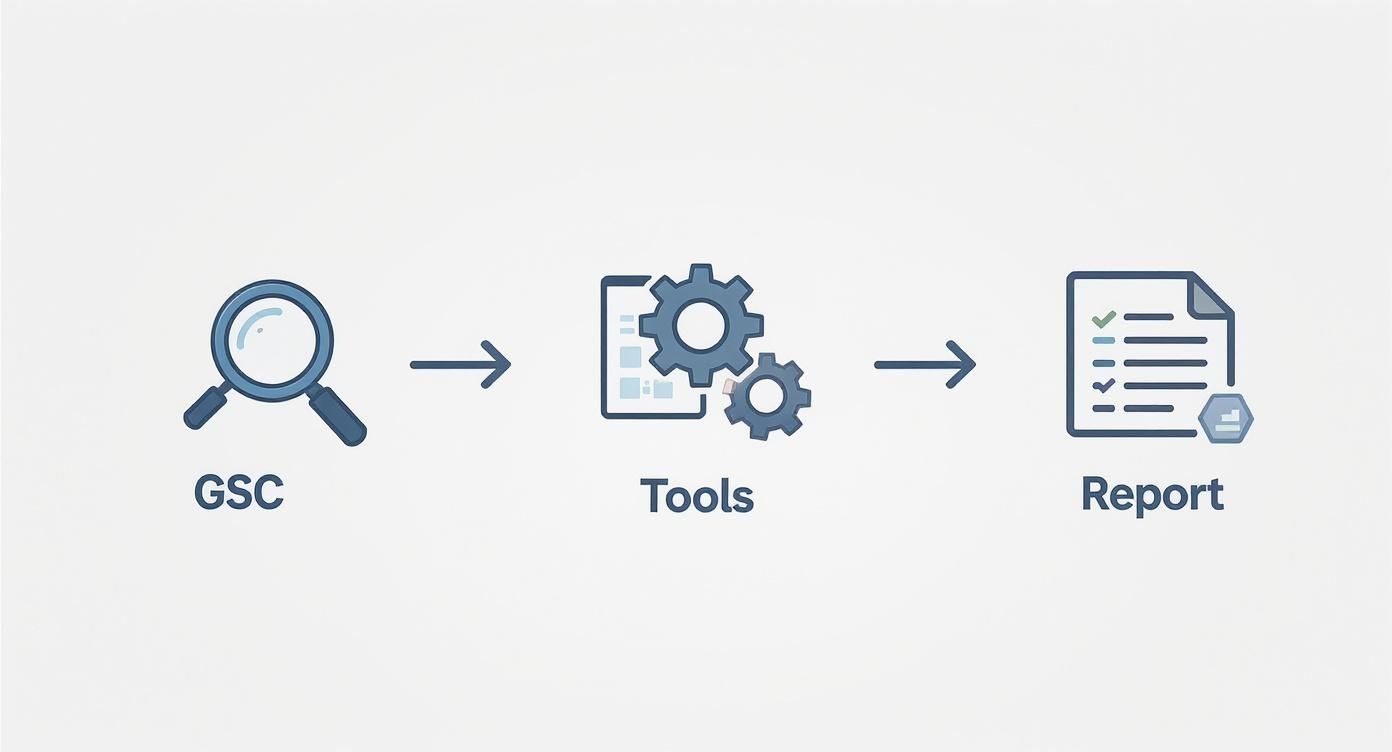
As you can see, it’s a flow from raw data sources, enriched with tool-specific metrics, and finally organized into a report that makes sense of it all.
Laying Out the Essential Columns
First things first, open a new spreadsheet and set up your columns. Each one of these is a piece of the puzzle, and together, they paint the full picture of your performance.
Your foundational setup should include these columns:
Keyword: The query you’re actually tracking.
Current Rank: Where you are right now.
Previous Rank: Where you were last month (or whatever your reporting period is).
Rank Change: The simple math between the current and previous rank.
Monthly Search Volume: How many people are actually searching for this term?
Target URL: The exact page you're trying to rank with this keyword.
This structure gives you an immediate, at-a-glance snapshot. You can instantly spot which keywords are making moves, see how much traffic potential they hold, and confirm the right pages are ranking for the right terms.
Pro Tip: The best reports are built for skimmers. A busy executive should be able to glance at your report and immediately identify the big wins and the red flags without you having to explain every single line item.
Making Your Data Visually Scannable
With your columns in place, it’s time to make the data easy to digest. This is where formatting becomes more than just decoration; it's a strategic tool. Simple visual cues can turn a dense wall of numbers into an actionable dashboard that guides the eye exactly where it needs to go.
My favorite trick for this is using conditional formatting on the "Rank Change" column. It's a total game-changer. This feature automatically colors cells based on their values, making trends impossible to ignore.
Here’s a simple setup I use all the time:
Positive change (improved rank): Color the cell green. Remember, moving from position 10 to 5 is a change of -5, so you'll set the rule for negative numbers.
Negative change (declined rank): Color the cell red if the value is positive (e.g., you dropped from 5 to 10).
No change: Just leave the cell with the default white or grey background.
This one technique makes your wins and losses leap off the page. A sea of green tells you it was a fantastic month. Pockets of red instantly show you where to focus your attention next. This kind of visual storytelling is what separates a decent report from one that actually drives smart, strategic action.
Uncovering Trends with Historical Data Analysis
A single SEO keyword ranking report is just a snapshot in time. It's useful, sure, but the real strategic gold is found when you start tracking your performance over months and quarters. That’s when you move beyond a static document and turn your report into a living tool for planning what’s next.
When you compare reports side-by-side, the story of your SEO efforts really starts to emerge. It’s how you can tell the difference between a minor, one-off ranking dip and a sustained downward slide that needs your immediate attention. This historical context is what allows you to make smart, proactive decisions instead of just reacting to every little change.
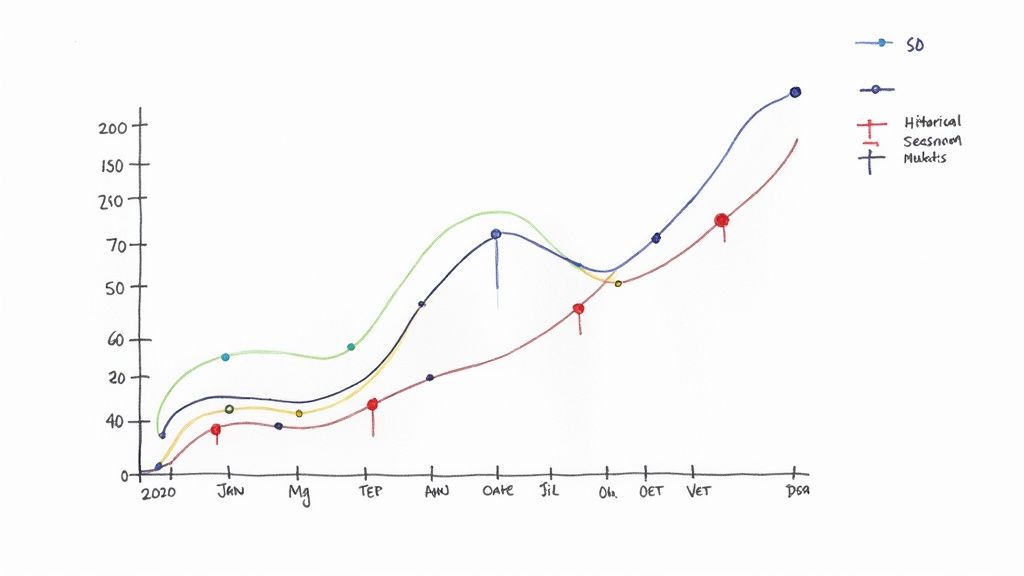
Identifying Seasonal Patterns
So many businesses have predictable ebbs and flows. Let’s say you run an e-commerce store. Your historical data might show a massive search spike for "outdoor summer gear" that kicks off every April like clockwork. Knowing this, you can get way ahead of the curve. Your team can start refreshing product pages and publishing new content in February, capturing that traffic while your competitors are still asleep at the wheel.
That kind of foresight is a massive competitive advantage. It lets you perfectly align your content calendar, sales promotions, and even your ad spend with how people actually behave, making sure you get the biggest bang for your buck when it counts.
By looking back at your performance data, you stop being reactive. You shift to a forward-thinking SEO strategy, using the past to predict—and shape—the future.
Historical SEO data is crucial for fine-tuning your entire marketing plan. Some tools even let you look back at keyword ranking history over several years, which is perfect for benchmarking your progress. For instance, comparing search volumes for a keyword from February to October might reveal clear seasonal trends or show new competitors jumping in. This helps you decide if a keyword is still worth targeting. You can learn more about how historical data guides SEO strategy on gbcdigitalmarketing.com.
Measuring Long-Term Impact and Algorithm Effects
Looking back over time also gives you the clearest picture of your long-term SEO impact. Remember that huge content overhaul you did six months ago? Plotting your rank changes on a timeline will tell you definitively if it actually worked.
This perspective is also absolutely essential for navigating Google algorithm updates. When you suddenly see a sharp, widespread drop in your rankings, the first thing you should do is check the date against known algorithm rollouts.
This helps you diagnose the problem:
Was it a core update? This often points to a need to improve your overall content quality or E-E-A-T signals.
Was it a spam update? Time to take a hard look at your backlink profile for anything fishy.
Was it a helpful content update? This is a huge clue that your pages aren't satisfying user intent as well as they need to.
Without that historical baseline, connecting these dots is just guesswork. Your collection of past SEO reports becomes your go-to diagnostic kit, helping you adapt quickly and build a more resilient SEO foundation.
Adapting Your Report for Global and Local SEO
Your SEO keyword ranking report can't be a one-size-fits-all document. If you serve customers in different cities, let alone different countries, you have to slice and dice your data to see the real picture. A single, global report can easily hide what's actually happening on the ground—masking a huge win in one region or a troubling decline in another.
To get strategic, you have to segment your data. This is all about tailoring your analysis to answer specific questions for distinct markets. For instance, instead of just tracking "running shoes," you should be watching its performance in the US while separately monitoring "zapatillas de running" in Spain. This simple change in perspective often reveals completely different competitive environments and user habits.
Tailoring for International Markets
Going global is so much more than just translating your keywords. Search volumes, keyword difficulty, and what people are actually looking for can be wildly different from one country to the next. This is where big-time keyword databases become your best friend.
We're lucky to have access to massive, up-to-date keyword databases with years of historical data, which has totally changed the game for global SEO. Some platforms, for example, offer Google Keyword databases with over 5 billion search terms, letting you look back several years. This gives marketers the power to analyze top keywords across dozens of countries, making it easier to forecast trends and build smarter international strategies. To get a sense of this scale, you can check out a list of the top 1000 most searched keywords on DataForSEO.
When you're building a report for international markets, you’ll want to zoom in on:
Country-Specific Search Volume: How does demand for your core topics change from one region to another?
Language Nuances: Are you tracking local slang and different keyword phrasings your audience actually uses?
SERP Feature Differences: Pay attention to which countries show more video carousels or image packs for your most important terms.
Zeroing In on Local Performance
If you're a business with a physical storefront or you target specific service areas, local SEO is everything. Your report needs to get granular and show performance at a neighborhood or city level. This is where you track rankings for keywords with local intent, like "HVAC repair in Austin" or "best coffee shop near me."
A strong local SEO keyword ranking report is less about broad visibility and more about dominating the search results that drive actual foot traffic or local service calls. It answers the question, "Are we visible to the customers right around the corner?"
To really track local performance, your report needs to monitor rankings within specific geographic areas. This usually means using specialized tools that can mimic searches from different zip codes or cities.
If you're just getting started or need to refine your local strategy, our complete local SEO checklist offers a great framework. By breaking your report down for each target location, you can quickly see which areas are crushing it and which ones need a more focused content or link-building push.
From Data to Dollars: Making Your Report Actionable
So, you've built a beautiful, detailed keyword ranking report. That's a great start, but it’s only half the battle. A report gathering digital dust doesn't do anyone any good. The real magic happens when you turn all that data into a repeatable process for growing your traffic. This is where you connect the dots between analysis and execution.
The first thing I always do is look for the low-hanging fruit. It’s so tempting to want to fix everything at once, but that's a surefire way to get overwhelmed and accomplish nothing. Instead, I zero in on the opportunities that will give me the biggest bang for my buck.
Where do I find these quick wins? They usually fall into two buckets:
Striking Distance Keywords: These are your golden opportunities. I'm talking about the keywords where you're already ranking on page two, typically in positions 11-20. You’re so close. Often, a small push—like adding a few more internal links, tweaking the title tag, or refreshing a section of the content—is all it takes to vault onto page one where the real traffic is.
Content Decay: This one is a silent killer. It's when a page that used to be a top performer slowly starts to lose its rankings. Your report is your early warning system. Spotting this decline early means you can jump in, update the article, and stop the bleeding before you lose a major source of traffic.
Setting Goals That Actually Work
Once I have my priorities straight, I set concrete goals. "Improve rankings" is a wish, not a goal. You need to get specific and hold yourself accountable.
A much better goal sounds something like this: "Move our five most important 'striking distance' keywords from page two to page one within the next 90 days." See the difference? It's specific, measurable, and has a deadline.
Of course, you have to be realistic. When setting your targets, always consider the keyword's difficulty and your site's overall authority. If you're not sure where you stand, our guide on how to find domain authority is a good place to start for benchmarking your site's strength.
Your keyword ranking report shouldn't just be a report card. It should be the roadmap for your entire content strategy. It shifts you from guessing what to write next to making data-backed decisions that drive real growth.
This creates a powerful feedback loop. You analyze the report, spot the opportunities, create an action plan with clear goals, and then—this is the most important part—you use the next report to see if what you did actually worked. This cycle is what turns a static document into the engine of your entire SEO program.
When you can show your team or your clients this clear, prioritized plan, it builds massive trust. You’re no longer just talking about rankings; you’re demonstrating a methodical strategy for capturing more traffic and growing the business.
Viral SEO is the lightweight, conversion-focused tool that removes the guesswork from your content strategy. Surface your competitors' top pages, organize your content ideas, and use data-driven insights to accelerate your organic growth. Get started with Viral SEO for free.
Blogs
More Blogs
From keyword goldmines to AI-driven content hacks—expert insights to help your blog posts dominate the first page.


